High Pass Filter Response
Dear Team,
We are using High Pass Filter(General EQ 2nd order Multi channel Double precision) in our application with below parameters
Q factor : 0.707
Response is observed as below
->Gain at cutoff frequency is observed as expected(-3dB of input) for the frequencies above 9HZ(10,20,100,1000Hz)
->Gain (at cutoff frequency)is not observed as expected for the frequencies below 9Hz(4,3,2,5HZ)
We are using SigmaStudio Tool Version4.5 and Processor ADAU1452 (SigmaDSP 300).
Kindly let us know feedback on this
Kind Regards,
Sivaramakrishna.
Audio Signal Processors
adau1452
SigmaDSP Audio Processors
Hello Sivaramakrishna,
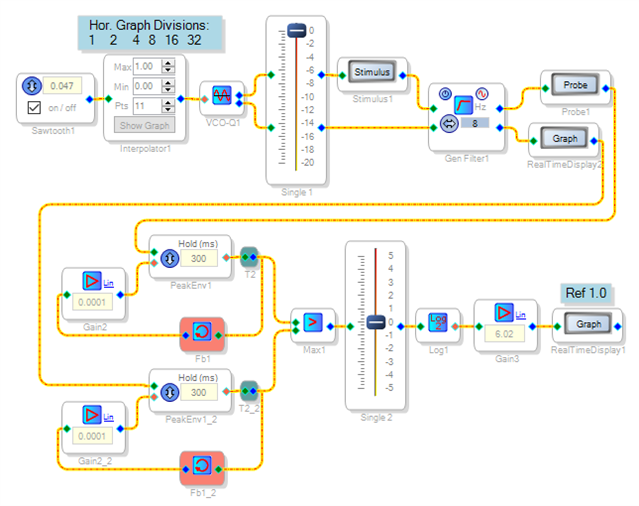
I built the project shown below in order to duplicate your results. It performs a logarithmic frequency sweep from 1 to 32 Hz, and measures the filter's response in dB:
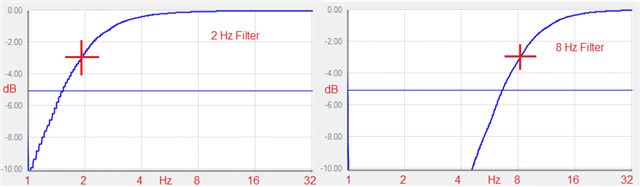
As shown, it feeds a stereo filter with two quadrature sine waves, measures the peak amplitude response of both channels and chooses the higher one -- this eliminates the ripple which would otherwise ruin the response curve at low frequency. The results appear on the Real-Time Display, with no external test equipment needed! Below is the response of a 2 Hz highpass filter and a 8 Hz highpass filter. The measured 3dB points appear nominal:
Were your measurements taken with external equipment (and thus include the codec (ADC and DAC) in your ADAU1452 hardware? I suspect that the usual AC coupling caps in the analog circuitry surrounding your -1452 might have influenced your results. Continued below (because the forum allows only two uploaded images per post).
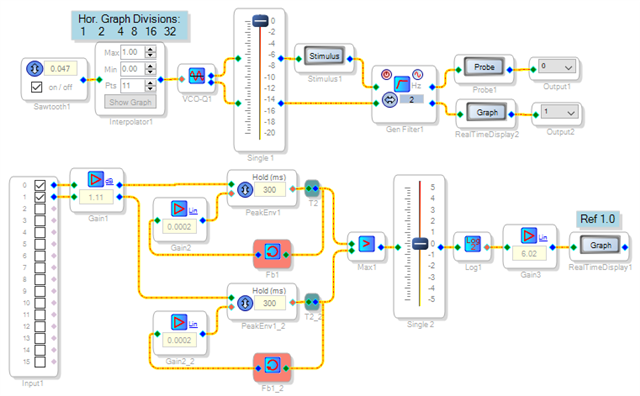
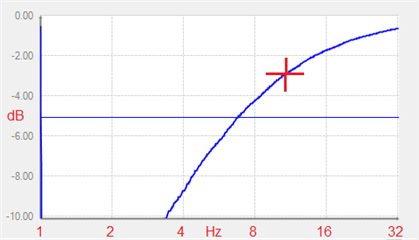
I suggest you repeat your measurements with the filter bypassed, to check the response of the entire system, from your analyzer to the ADC, through your SigmaStudio project to the DAC and back to the analyzer. For example, the project below is like the one above, except now the signal goes out the DAC of the ADAU1452MINIZ board and routes back to its ADC input with a cable:
With the filter bypassed, the overall frequency response shows 3 dB down at 11 Hz. Thus my eval board would not give accurate results at the low frequencies your filter tests need.
Best regards,
Bob
Dear KJBob,
Thank you for the response,
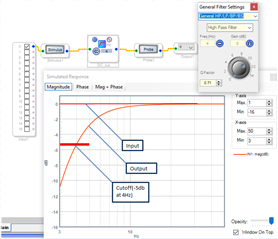
I have tried to get response of filter using Stimulus and probe ,We are using High Pass Filter(General EQ 2nd order Multi channel Double precision) with cutoff frequency 4Hz and Q factor 0.707 ,we expect the Gain at cutoff frequency is observed as-3dB of input,but nearly -5dB is observed at 4KHz.Kindly find the observations as in the image kindly let us know the feedback on this
Kind Regards,
Sivaramakrishna.
Hello Sivaramakrishna,
The Stimulus and Probe feature is there to give you a general idea of what the filter is doing. It is not a laboratory representation of the filter curve. Generally it is best to use an audio precision to test the filter. You can go analog to analog but then the converters will influence the results. If you have the digital serial interface for the Audio Precision then you can go in and out digitally and look at the filter. Another option is to take the filter coefficients and drop them into MatLab to see what the filter will do. MatLab is designed to accurately graph filters where we add the feature just to help verify what is going on so we did not write a lot of code like MatLab did.
Dave T
Hello all,
Funny -- at first I tried Stim-Probing the filter and in my case finding nothing unusual, my response devolved into the elaborate stuff above. What a waste of time. One of the issues I've found with Stimulus-Probe is its limited horizontal resolution -- it doesn't always calculate enough frequency points to give a "nice-looking" plot. This is noticeable with high-Q peaking filters.
Not all engineers have Matlab or an AP available -- where I work audio is a sideline so there's no way to justify these extravagances. jon71 has suggested using a Focusrite USB interface plus software to do some of what an AP does. Making a test project like the ones had shown above needs no test gear at all, and can be used without involving the converters and their associated analog HW.
Best regards,
Bob
Hello Bob,
Your responses above with your projects are such excellent examples of using the resources of the DSP itself to make some measurements and to troubleshoot/verify problems. It takes my efforts to show people how to use SigmaStudio as a tool to look into what is going on in the DSP to solve issues a step further.
People who are learning about how to use SigmaStudio should study these examples. Awesome!
Dave T
Please log in to reply.