How can I get the real time MIPS of SigmaDSP
Hello,
My customer wants to know how to measure the real time MIPS for SigmaDSP(ADAU1452).
If they do not know exactly this, they do not know the margin of their design.
They regards this as security against quality.
If anyone know how to measure MIPS for SigmaDSP, please let me know.
Thanks,
Hi,
Most of the blocks in SigmaStudio give an accurate count of MIPS in the compiler window, There are some cases in which this cannot be calculated at compile time, but the number of instructions is still constant.
Please PM me, and I can give you some assistance.
Ken
Hi Ken,
Thanks for your reply.
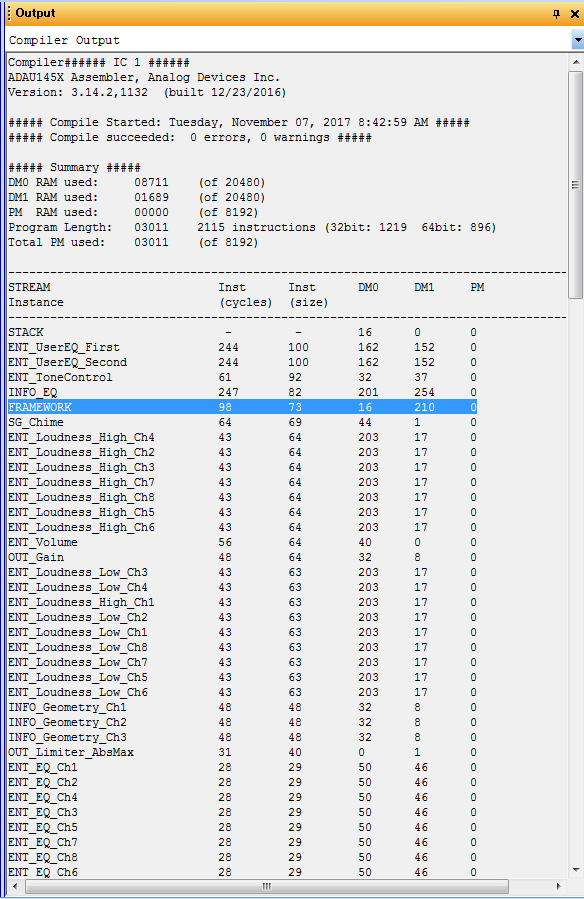
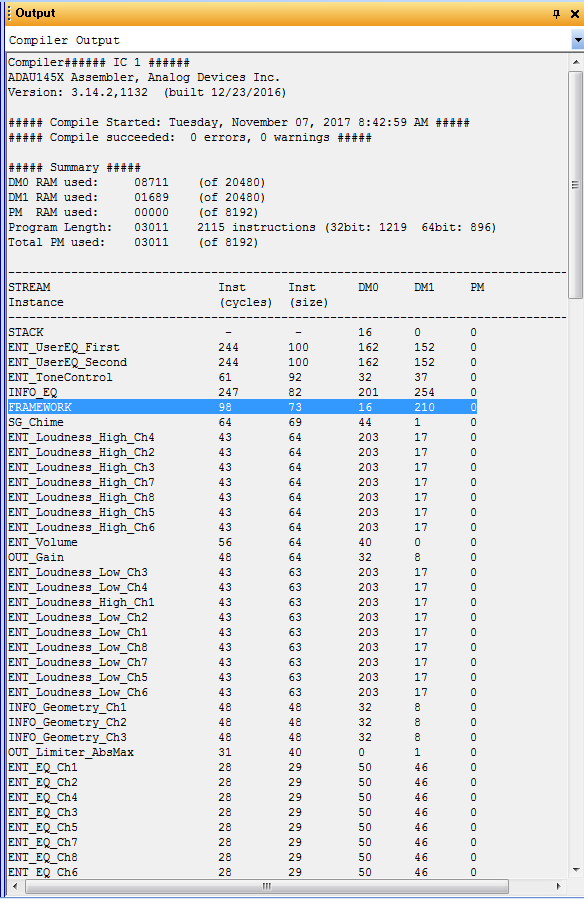
Please see the following log outputs.
"Inst(cycles)" means the maximum processing cycle count?
And also, it seems that "FRAMEWORK" doesn't include processing cycle of "IndirectParameterAccessTable".
It it right?
Thanks,
Hello,
Perhaps by "real time," you mean having the DSP reveal its loading while in operation. As you likely know, this is commonly done by adding a few lines of code to toggle a port at the beginning and end of a time-critical routine. Can this be done in SigmaStudio? We can try...
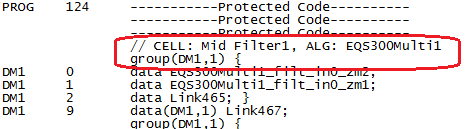
Starting with an old, rather large ADAU1452 project, its output file shows the various blocks in order. The first block other than DC sources is the input block feeding a filter:
The last block, logically enough, is an output:
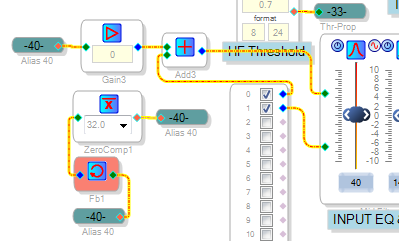
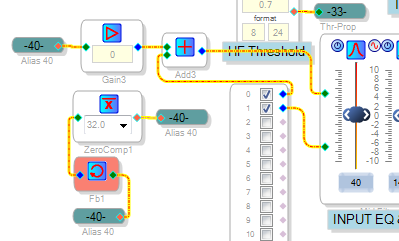
What might we use to tag these time extremes in the signal flow? We can have a zero comparator chase its tail, oscillating at fs/2. Place one of these so it contributes to the input, as shown here:
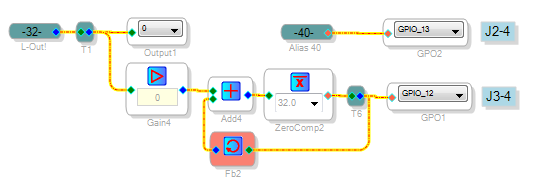
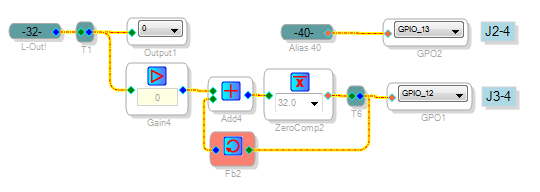
This connection forces the compiler to place this oscillator at the head of the signal flow. Another oscillator attached to the output compiles at the tail end of the operations:
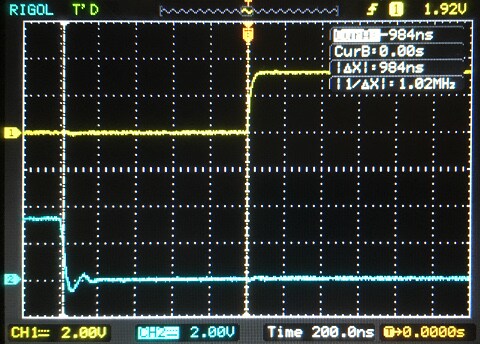
Scoping the two GPIOs reveals a 984 nS sliver of time between two GPIO transitions, suggesting this much time left over out of the (1/48K=20.83 uS) sample interval. Thus, this project uses about 95% of the available time for instructions.
Best regards,
Bob


Hi Bob,
Thank you for a wonderful idea.
I think that this function is very good if it is equipped in the tool as a built-in library.
I guess that many other users also want such functions.
I hope that this will be provided as a future standard function.
Thanks and Regards,
That's an insightful idea! Such a debugging block would improve on the DIY approach several ways:
The compiler knows exactly the start and finish points.
It could use just one GPIO.
Or none at all when SigmaStudio is connected (like a readback).
All this is moot with Sigma 100 chips (ADAU1701, etc.), because they don't branch and their unused program space is padded with NOPs. Yet the more advanced the DSP, the more important this becomes.
Hello takumi3952,
Myself and others here at ADI have seen the need for tracking the execution of the program inside the DSP to see if the program uses too many MIPS. I submitted a proposal a couple of months ago and the programming team has been working on it. I expect it to be released soon. The problem of MIPS usage is actually a little more complicated with recent capabilities added to the Sigma300/350 line. The ability to process blocks has been there for a while but is recently becoming more useful and we also added the ability to have multiple sample rate threads all running at the same time. This makes for a somewhat variable MIPS load from frame to frame. What I proposed was to setup a means to detect when a thread was not able to complete and to report what kind of thread it was. Then it would throw a software panic code that can be trapped with a uC. This would not give you the left over MIPS since that will vary from frame to frame as multi-rate threads and block processing starts and stops but it will tell you if it was exceeded. So once a program has run for an extended time to account for all the processing threads, and no errors were detected then most likely it will be fine.
To answer one of your questions, I am fairly certain that the indirect parameter table is handled as part of the framework code.
So for now the compiler usage report is still the best way to get an estimate of available MIPS but it is difficult to know exactly how much remains.
Dave T
There are registers specifically for this purpose:
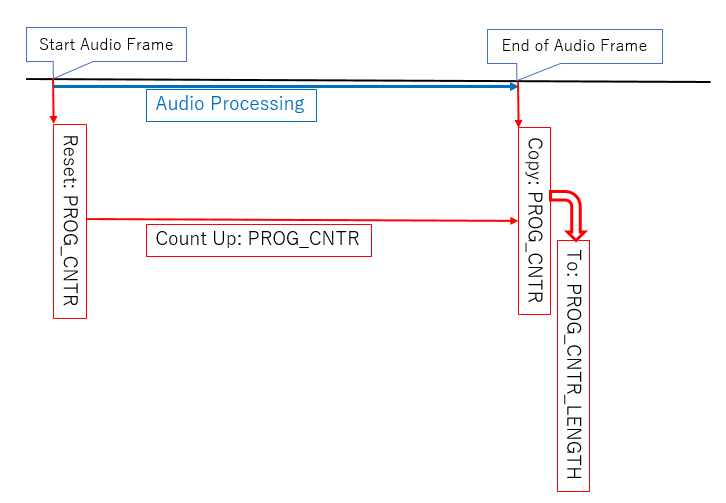
PROG_CNTR (0xF460, 0xF461) is a 24-bit counter running on the core clock. It is automatically reset at the start of the audio frame. Reading its upper half (0xF461) causes the counter value to be latched into PROG_CNTR_LENGTH (0xF463 + 0xF464). The DSP programs produced by SigmaStudio do this automatically at the end of the frame interrupt handler, thus PROG_CNTR_LENGTH shows the number of cycles used by the most recent frame interrupt. The highest value it has attained (which is usually what you want to know) is recorded in PROG_CNTR_MAXLENGTH (0xF465 + 0xF466), which can be reset using PROG_CNTR_CLEAR (0xF462).
The ratio between PROG_CNTR_LENGTH and the number of cycles per audio frame (i.e. core clock frequency / sample rate) should be an accurate "cpu load" indication, at least if there's nothing taking up cpu time other than the frame interrupt handler. Things like multirate or block processing may complicate things.
Basically, yes. And I agree the documentation of these registers in the datasheet is inadequate. I determined their exact behaviour by testing.
To be a bit more precise, PROG_CNTR is reset specifically on the start pulse signal (selected in the START_PULSE register). This normally triggers the frame interrupt in which audio processing is done, but for example even if the frame interrupt is disabled using the HIBERNATE register or even if the core is not even running, PROG_CNTR still gets periodically reset. This also means that if the frame interrupt gets delayed for any reason (i.e. if there's other code running that temporarily disables irqs), this delay time is added to the value that ends in PROG_CNTR_LENGTH.
(Also, I made a slight mistake in my previous post: the upper half of PROG_CNTR is at 0xF460, the lower half is at 0xF461.)
A formal description in pseudocode would be:
every core clock cycle:
PROG_CNTR = (PROG_CNTR + 1) & 0xffffff;
every start pulse:
PROG_CNTR = 0;
on rising edge of PROG_CNTR_CLEAR:
PROG_CNTR_LENGTH = 0;
PROG_CNTR_MAXLENGTH = 0;
when register 0xF460 (upper half of PROG_CNTR) is read:
PROG_CNTR_LENGTH = PROG_CNTR;
if( PROG_CNTR_LENGTH > PROG_CNTR_MAXLENGTH )
PROG_CNTR_MAXLENGTH = PROG_CNTR_LENGTH;
Hi matthijs,
Thanks for your reply.
I knew that there were registers that you taught, but I did not know how to use it.
What you explained will be followings?
Is the content of this diagram correct?
I think the data sheet does not provide detailed usage of this register.
Please let me know if you know detailed usage instructions are presented.
Thanks and Regards,
Hi matthijs,
Thanks for your reply.
I think it is a useful function depending on usage.
To everyone reading this article:
Do you think that it is appropriate to officially inform mass production customers how to use these registers?
(PROG_CNTR/ PROG_CNTR_LENGTH/ PROG_CNTR_MAXLENGTH/ PROG_CNTR_CLEAR)
Why is not the proper usage suggested?
Do customers have to take risks and use them?
Thanks and Regards,
matthijs, KJBob, and takumi3952
Thank you for your insight and contribution to the forum. As you point out, there are hardware updated registers to help determining the "high water mark" of the program counter. Part of the reason that these are not very well documented in the data sheet is that they are not accurate when the processing goes beyond the most basic signal flows. While these registers do read the program counter just prior to the jump to top of frame, the value they contain does not necessarily accurately reflect the number of instructions that have been executed during that sample frame. Specifically, (A) multi-rate processing, (B) block signal processing, and (C) blocks that utilize variable conditional execution, which does not work with compile-time static profiling, are not correctly accounted for.
We recognize that this is a serious shortcoming in the tools. The available functionality is implemented in hardware, and the framework has expanded in unforeseen ways far beyond the capabilities of prior SigmaDSP architectures. However, as David points out, we have a number of software-based solutions that would provide considerably more accuracy and insight. Dynamic profiling in some form is required. We are working on the technical details (and resource prioritization given the deep queue of requests for high-priority features).
In the meantime, KJBob's suggestion of using GPIO flags is an excellent one. Stream processing executes left to right in the schematic. This allows the graphical equivalent of "printf debugging." If you have a critical need or are seeing intermittent behavior, please contact me off-line, and I may be able to help you using tools we use internally.
Best regards,
Ken
Please log in to reply.