IIR cascade FIR, incorrect phase response display
Hello.
I'm using chip ADAU 1701, fs=48000.
Sorry, I am a newbie in filter designing.
I would like to design an IIR Notch filter at 1kHz. I used "ScopeIIR" software to get the IIR coefficients.
Then, I feed that IIR output into another FIR filter to correct the phase shift. I'm using 'rephase' to design the FIR filter and get 128 taps of impulse response and then fill in the FIR filter in SigmaStudio.
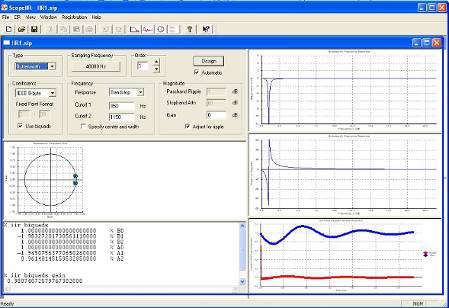
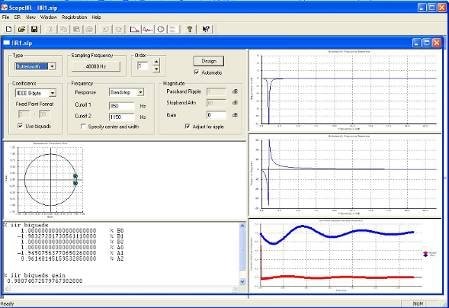
Below is capture screen "ScopeIIR":
IIR filter generates some phase shift around 1kHz. (Q=1, Butterworth, cutoff at 1kHz, fs_1=850, fs_2=1150).
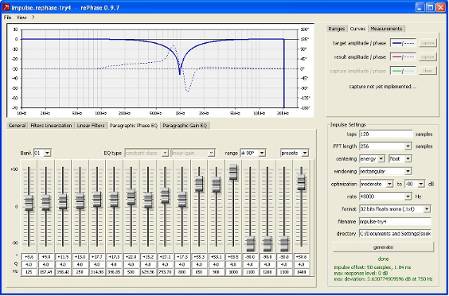
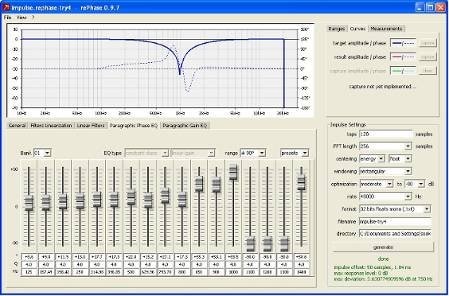
Then, I import the magnitude and phase response from above IIR filter into "rephase". And then adjust the Paragraphic Phase EQ to archieve phase shift correctness. After done, i generate 128 taps(FIR coeff) of impulse response in text file. Then i load that FIR coeff into Sigma Studio.
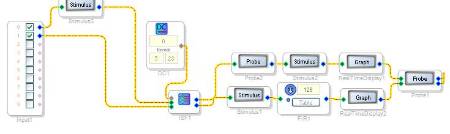
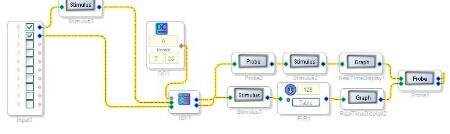
Belowis my SigmaStudio project design.
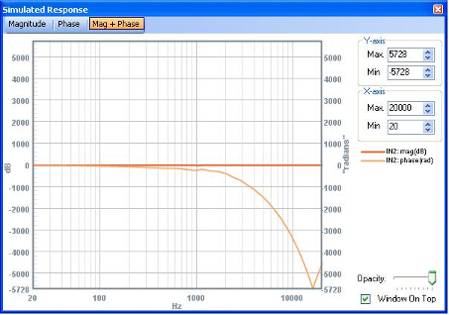
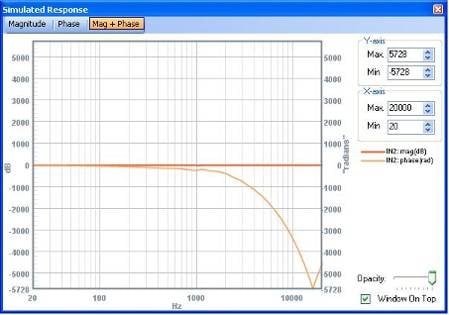
But I could not get the expected result in Simulation Probe. I guess the output should be a linear line 0 degree.
This is the screen of phase display:
Am I using wrong method to get the FIR coeff? Or the simulated phase displayed is incorrect?
Hope to hear from you soon.
Thanks alot,
JCB
Hello JCB,
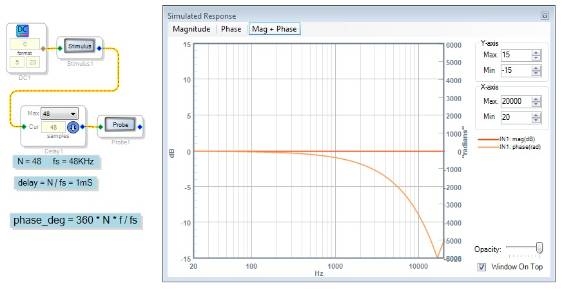
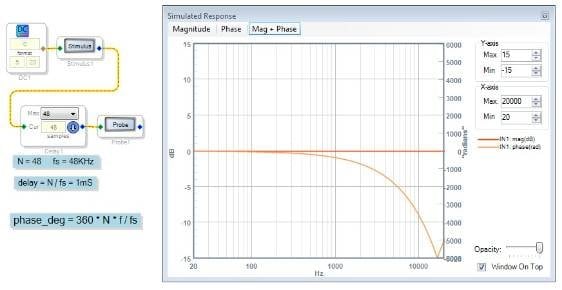
The Stimulus and Probe blocks calculate the absolute phase of the filter(s) placed in between. Thus any group delay shows up as a constantly increasing phase lag. To demonstrate this, below shows a straight 48-sample delay and its predicted response:
Notice how closely this phase response matches your plot. This suggests that your filter has a group delay of about 48 samples (1mS at 48KHz sample rate). FIR filters can have a group delay somewhere between zero and the filter's length, for a large class of them it's half the kernel length. The pure delay component of a filter's phase shift is by definition linear phase. Where the filter under test deviates from this pure delay characteristic is that filter's phase distortion.
The "wiggles" in your filter's plot between 700 and 1500 hertz represents its remaining phase distortion. Setting the Probe window's frequency range accordingly will allow you to zoom in on this area of interest with an expanded scale. It would be cool if the Probe window had a way to subtract out the known group delay to show just the phase distortion -- perhaps the SigmaStudio team could consider adding such a feature.
Best regards,
Bob
This question has been assumed as answered either offline via email or with a multi-part answer. This question has now been closed out. If you have an inquiry related to this topic please post a new question in the applicable product forum.
Thank you,
EZ Admin
Please log in to reply.