Plotting filters frequency response
Hello,
First, I'd like to apologize if this post isn't on the right section of the forum. Since we are using SigmaDSP on our product and I couldn't find a sub-forum that would fit this question best, I posted it here. Before that I tried to contact some people via private message, but seems that it has been deactivated?
We have been developing a car audio processor that features Xovers, parametric EQs, etc. Everything is working beautifully, including all the formulas that gerenate the coefficients for the filters that are passed onto the DSP for processing.
However, I still couldn't find a solution to display these filters frequency respose, especially the Peaking EQ, which would provide a very useful visual feedback for the user. Every competitor has that, like this one:
What I've been looking for without success, is a way to plot the filter's frequency response, ESPECIALLY the Peaking EQ. I've been doing numerous tests, for example, I tried to plot the Peaking EQ by the center frequency, gain and bandwidth relation, but never got close enough to the real frequency response that I can see on the RTA measurement. I was hoping I could find a formula that I can use to find the points to plot. Since I haven't had sucess trying to find it, I created this post hoping that someone here can give me a point to start.
Any help will be greatly appreciated!
Thank you.
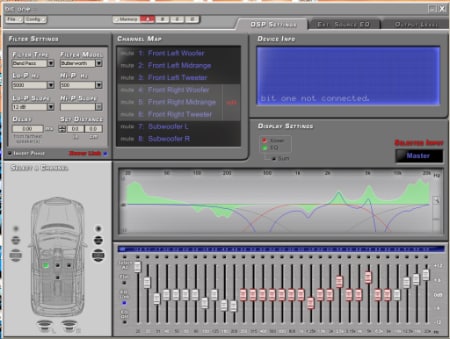
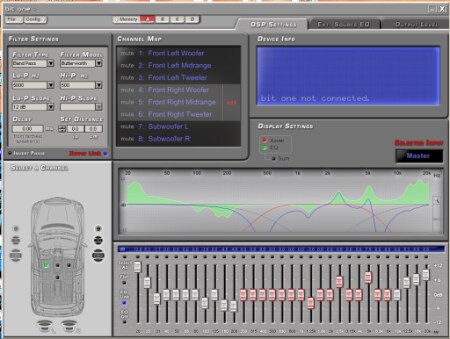
Hi Nando:
I'm not sure how you are calculating the transfer function but if it comes from the coefficients calculation, then all; SigmaStudio , your applications and the attached screenshot should yield the same results. The basic idea is that you need to calculate your transfer function using the following equality. H(z) = H(e^(i*w)). Since this topic is beyond the use of either SigmaStudio and/or SigmaDSP, please send me a private message if you need additional help.
Miguel
Hello Miguel,
Thank you. How can I send you a private message? Your email appears as private and I can only follow you, but apparently I can't send you a PM.
Hi Miguel and all,
The attached Open Office spreadsheet shows an example H(s) magnitude calculation for a parametric EQ filter.
Best regards,
Bob
This question has been assumed as answered either offline via email or with a multi-part answer. This question has now been closed out. If you have an inquiry related to this topic please post a new question in the applicable product forum.
Thank you,
EZ Admin
Please log in to reply.