MATLAB SOS matrix to cascaded IIR blocks for higher order filters
I have been trying to implement a filter I designed in MATLAB using the 2nd order IIR blocks in SigmaStudio but with no luck... I found that MATLAB's filter design tool will output a filter in a matrix for use in cascaded 2nd order IIR filters... but when I put these coefficients into the IIR block and do a Stimulus/Probe the resulting plot looks like the one MATLAB produces, but it appears inverted! Am I missing something simple here like a negative sign?
Maybe some screen shots will help...
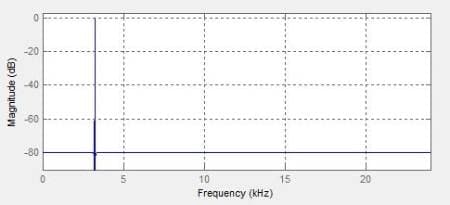
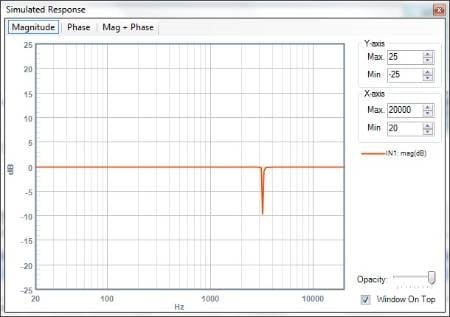
This is from MATLAB, it is kind of hard to see but the bandpass is centered at 3222 Hz and is very sharp....
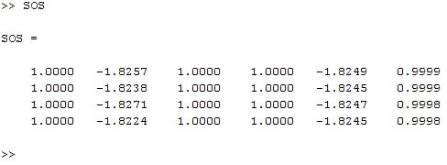
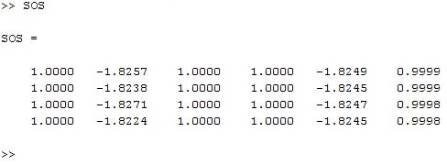
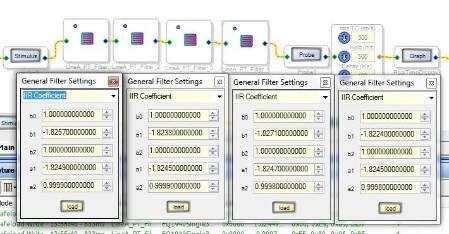
Here is the output from the filter design tool... According to the mathworks site ( http://www.mathworks.com/help/signal/ref/tf2sos.html) from left to right is b0, b1, b2, 1, a1, a2
So I plugged those values into the IIR filters in the order it gave me...
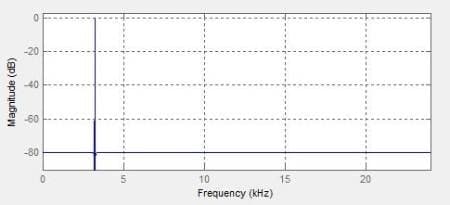
And this is the output from SigmaStudio.... The peak is around 3222 Hz which is why I think it has inverted itself somehow (the gains are way off too)...
Any suggestions would be greatly appreciated... I'm not sure where I went wrong here...
Thanks,
-Andrew
Audio Signal Processors
cascade
filter
adau1442
order
higher
matlab
sigmastudio
SigmaDSP Audio Processors
SigmaDSP
iir
Show More

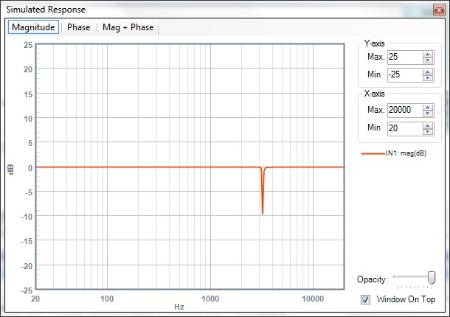
Well, after playing around some more I have come to the conclusion that the filter I made was too steep. Once I made the passband wider the SigmaStudio plot started looking correct. I did notice that the gains are way off (MATLAB's "G" vector contains the gain entries, something else I learned) but in order to implement the gain that MATLAB gave me I would have to mix 5.23 and 28.0 formats, which I read was a dangerous thing to do since it could lead to a buffer overflow... So instead I just put a volume control at the very end of the filter and by viewing the plot and changing the volume control I could get the filter to look the way I wanted.
Hope my troubles and lesson learned are helpful to someone else...
-Andrew
andrewbaker.me
Hi Andrew,
Thanks for sharing your problem and solution. Let me know if you need further assistance.
Please log in to reply.